Creating an advanced scientific graphic calculator requires a combination of a well-designed user interface and robust mathematical capabilities. Below is an example using JavaScript with HTML and CSS for the front-end, and a JavaScript math library (such as math.js) to handle the mathematical computations.
Step-by-Step Guide
1. Set Up HTML Structure
We’ll create the basic HTML structure for the calculator.
html<!DOCTYPE html>
<html lang="en">
<head>
<meta charset="UTF-8">
<meta name="viewport" content="width=device-width, initial-scale=1.0">
<title>Advanced Scientific Graphic Calculator</title>
<link rel="stylesheet" href="styles.css">
</head>
<body>
<div class="calculator">
<input type="text" id="display" disabled>
<div class="buttons">
<!-- Row 1 -->
<button onclick="clearDisplay()">C</button>
<button onclick="deleteLast()">DEL</button>
<button onclick="appendToDisplay('(')">(</button>
<button onclick="appendToDisplay(')')">)</button>
<!-- Row 2 -->
<button onclick="appendToDisplay('7')">7</button>
<button onclick="appendToDisplay('8')">8</button>
<button onclick="appendToDisplay('9')">9</button>
<button onclick="appendToDisplay('/')">/</button>
<!-- Row 3 -->
<button onclick="appendToDisplay('4')">4</button>
<button onclick="appendToDisplay('5')">5</button>
<button onclick="appendToDisplay('6')">6</button>
<button onclick="appendToDisplay('*')">*</button>
<!-- Row 4 -->
<button onclick="appendToDisplay('1')">1</button>
<button onclick="appendToDisplay('2')">2</button>
<button onclick="appendToDisplay('3')">3</button>
<button onclick="appendToDisplay('-')">-</button>
<!-- Row 5 -->
<button onclick="appendToDisplay('0')">0</button>
<button onclick="appendToDisplay('.')">.</button>
<button onclick="appendToDisplay('+')">+</button>
<button onclick="calculateResult()">=</button>
<!-- Row 6 (Scientific functions) -->
<button onclick="appendToDisplay('sin(')">sin</button>
<button onclick="appendToDisplay('cos(')">cos</button>
<button onclick="appendToDisplay('tan(')">tan</button>
<button onclick="appendToDisplay('log(')">log</button>
<button onclick="appendToDisplay('sqrt(')">√</button>
<button onclick="appendToDisplay('^')">^</button>
<!-- Graph function -->
<button onclick="plotGraph()">Graph</button>
</div>
<div id="graph"></div>
</div>
<script src="https://cdnjs.cloudflare.com/ajax/libs/mathjs/9.4.4/math.min.js"></script>
<script src="scripts.js"></script>
</body>
</html>
2. Create CSS for Styling
Here’s the CSS for styling the calculator.
css/* styles.css */
body {
font-family: Arial, sans-serif;
display: flex;
justify-content: center;
align-items: center;
height: 100vh;
margin: 0;
background-color: #f0f0f0;
}
.calculator {
width: 320px;
padding: 20px;
border-radius: 8px;
background-color: white;
box-shadow: 0 0 20px rgba(0, 0, 0, 0.1);
}
#display {
width: 100%;
padding: 10px;
font-size: 1.5em;
margin-bottom: 10px;
border: 1px solid #ccc;
border-radius: 4px;
text-align: right;
}
.buttons {
display: grid;
grid-template-columns: repeat(4, 1fr);
gap: 10px;
}
button {
padding: 20px;
font-size: 1.2em;
border: none;
border-radius: 4px;
background-color: #f0f0f0;
cursor: pointer;
transition: background-color 0.2s;
}
button:hover {
background-color: #ddd;
}
#graph {
margin-top: 20px;
height: 300px;
border: 1px solid #ccc;
border-radius: 4px;
}
3. JavaScript for Functionality
Now, let’s add the JavaScript to handle the calculator operations and plotting graphs.
javascript// scripts.js
const display = document.getElementById('display');
function clearDisplay() {
display.value = '';
}
function deleteLast() {
display.value = display.value.slice(0, -1);
}
function appendToDisplay(value) {
display.value += value;
}
function calculateResult() {
try {
display.value = math.evaluate(display.value);
} catch (error) {
display.value = 'Error';
}
}
function plotGraph() {
const expression = display.value;
try {
const fn = math.compile(expression);
const xValues = math.range(-10, 10, 0.1).toArray();
const yValues = xValues.map(function (x) {
return fn.evaluate({ x: x });
});
const trace = {
x: xValues,
y: yValues,
type: 'scatter'
};
const layout = {
title: 'Graph of ' + expression,
xaxis: { title: 'x' },
yaxis: { title: 'y' }
};
Plotly.newPlot('graph', [trace], layout);
} catch (error) {
display.value = 'Error';
}
}
Additionally, you need to include Plotly for graph plotting. Add the following line in your index.html:
html<script src="https://cdn.plot.ly/plotly-latest.min.js"></script>
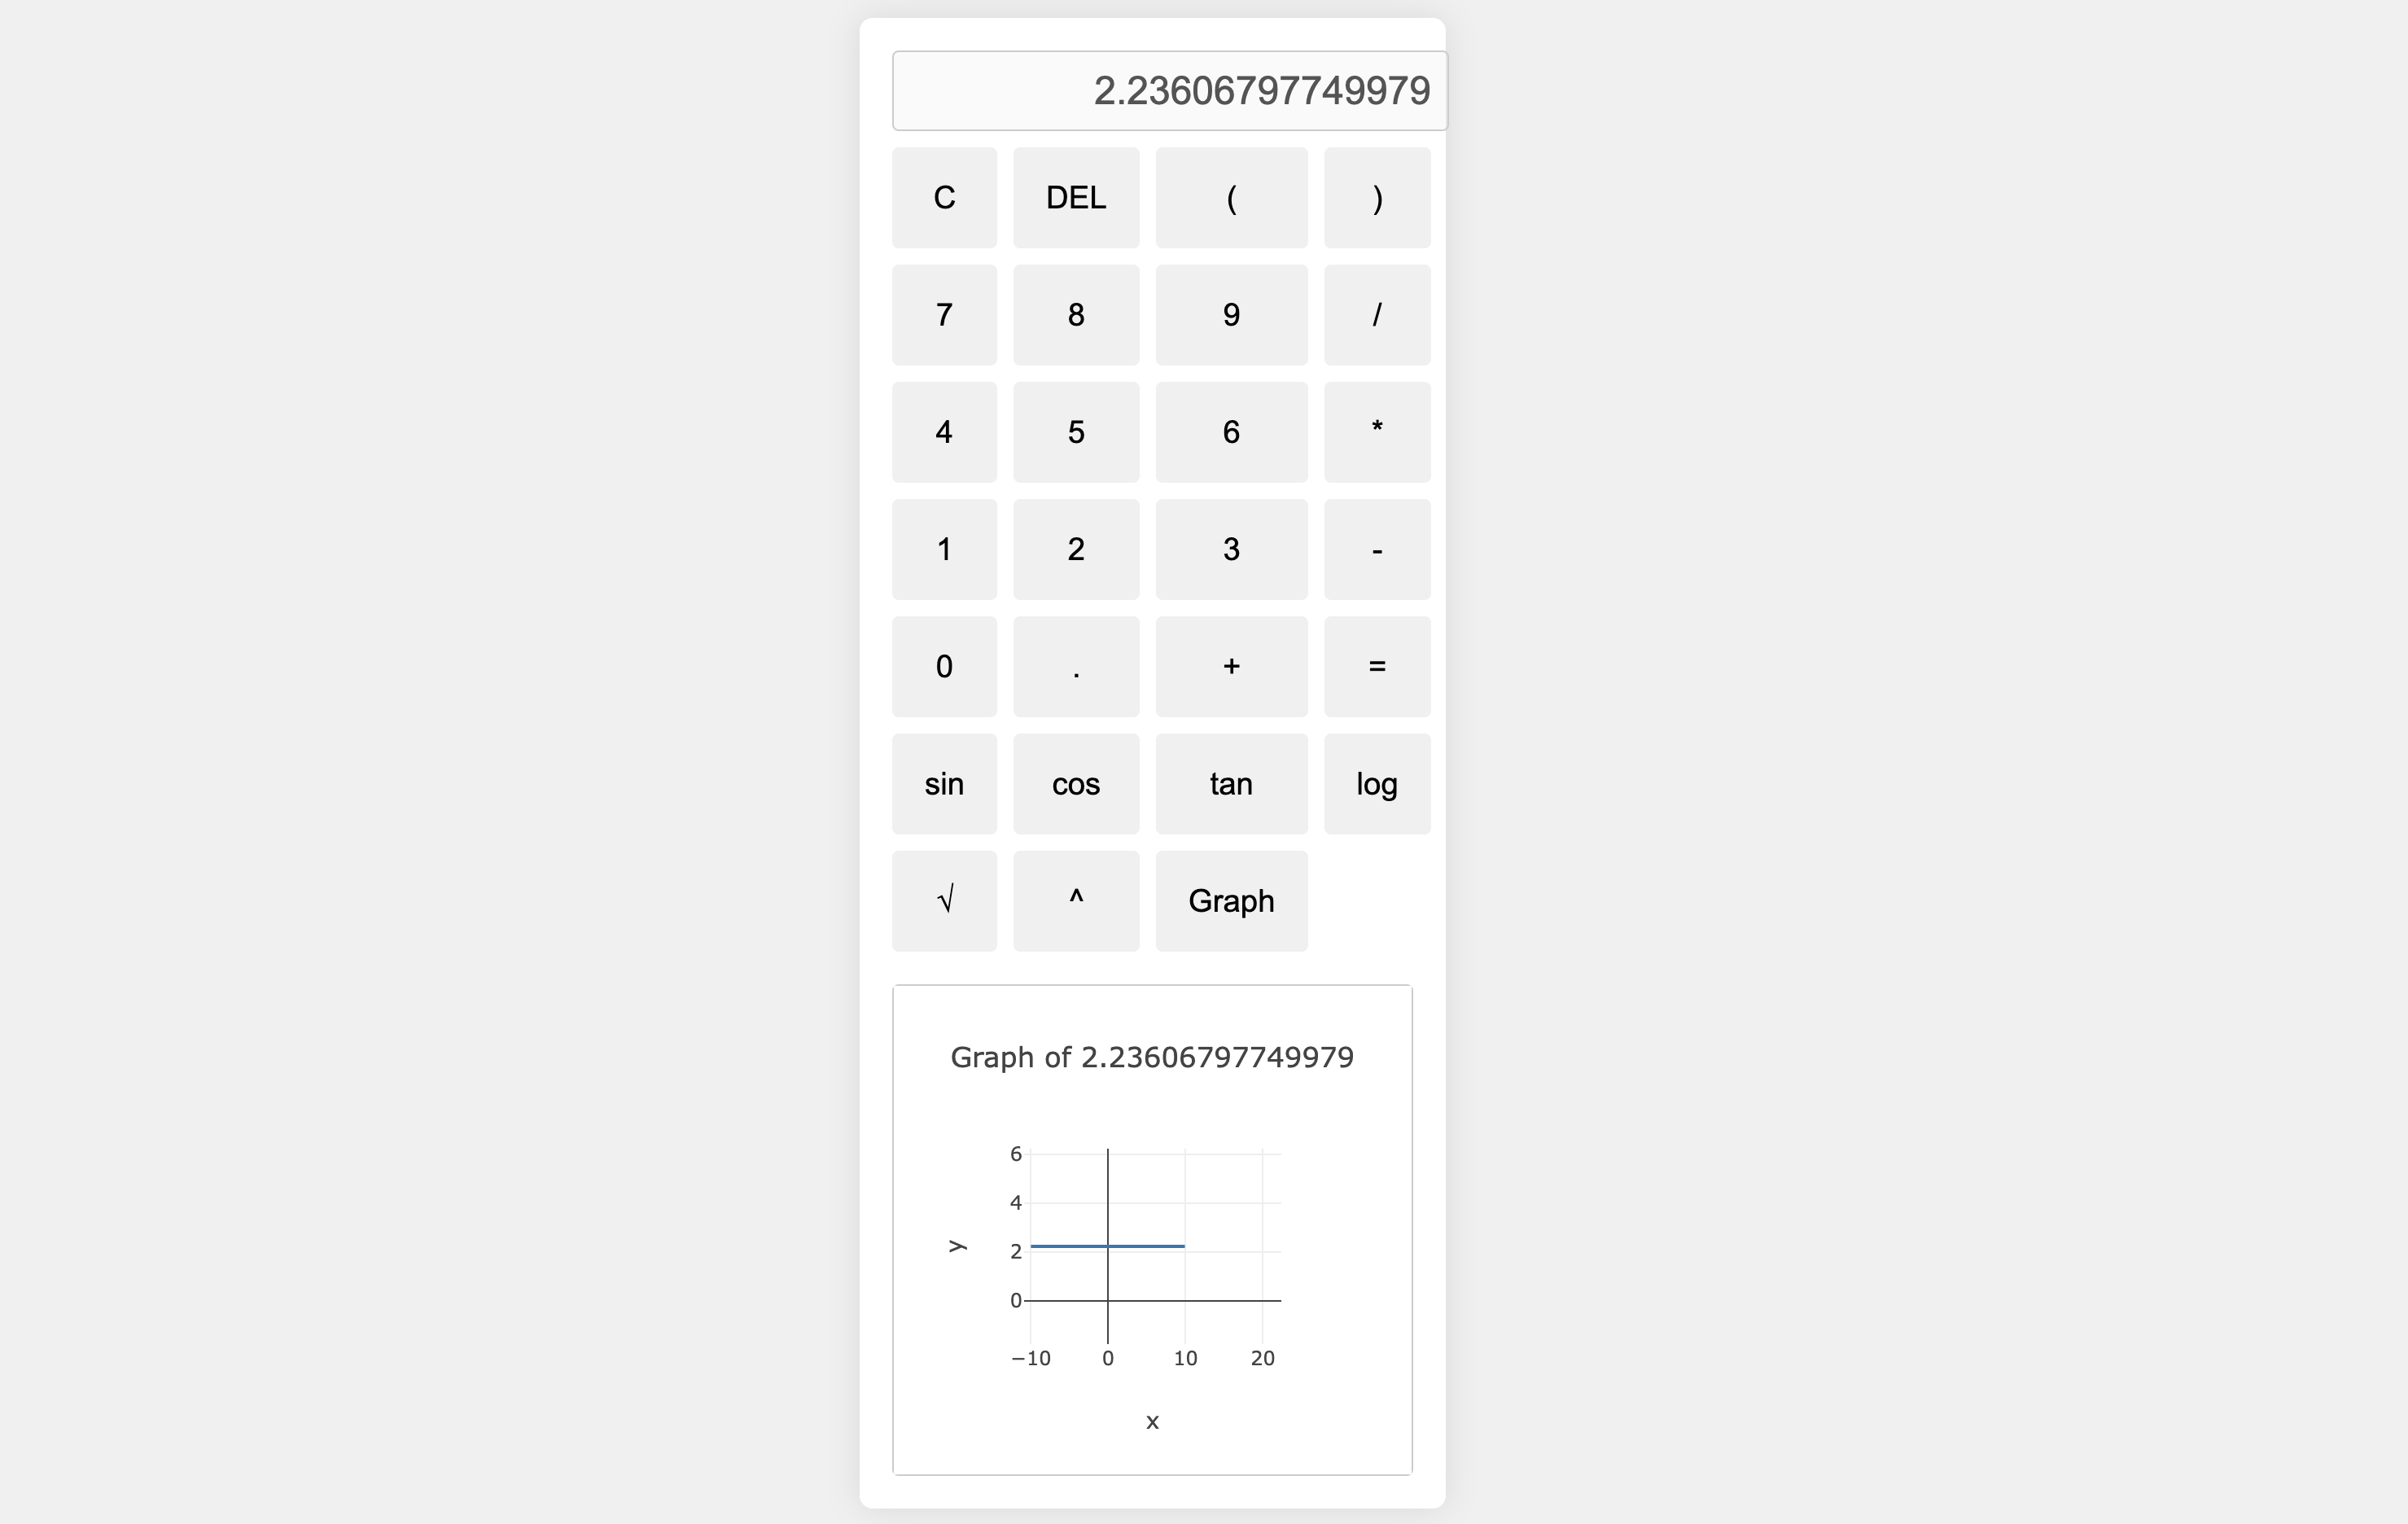
Summary
This example demonstrates how to create a simple advanced scientific graphic calculator using HTML, CSS, and JavaScript. This calculator supports basic arithmetic operations, scientific functions, and graph plotting. You can further enhance it by adding more features and improving the user interface.
Remember to test thoroughly and handle all edge cases to ensure a smooth user experience.
Leave a Reply